Trams, bicycles and city growth
The chart below shows how, over the centuries, distances became longer within the four largest cities of the Netherlands (see below for caveats). All cities started to grow faster in the second half of the 19th century.
Amsterdam didn’t change much between the 17th century and 1850. After 1850, the city tentatively started to expand beyond the Singelgracht, initially with luxury houses near the new parks. Below is a tram and omnibus map that shows what Amsterdam looked like in 1889.
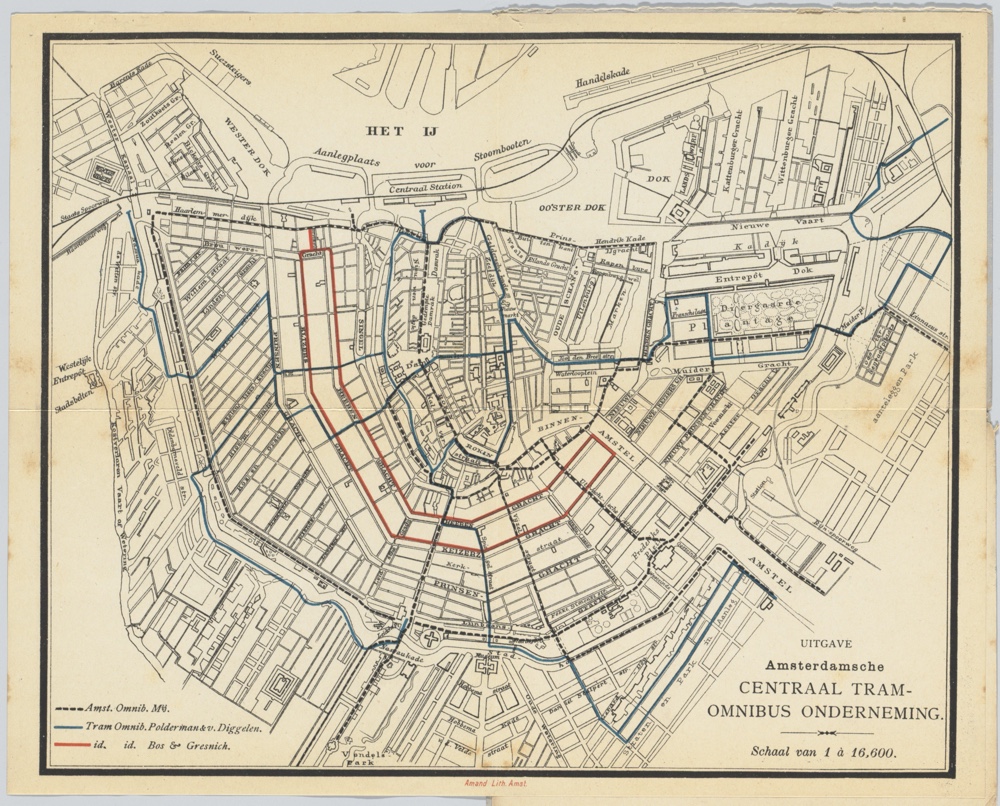
The Sarphatipark and Oosterpark and streets near the Sarphatipark are marked as ‘under construction’.
The reason why I looked into the growth of Amsterdam is an interesting article by Jonathan English on the relation between city size and means of transportation, published on City Lab. English quotes the ‘Marchetti Constant’, which holds that people are generally willing to spend about half an hour commuting to work. As means of transportation become faster, people will be willing to travel further. As a result, cities can grow larger.
Since horse-drawn transportation isn’t much faster than walking, the maximum size of cities was long determined by walking speed. This allowed for a commute of about one mile, English argues (he appears to assume rather low walking and cycling speeds). This didn’t change until the 19th century.
In the first half of the century, trains enabled commutes between cities. In the 1880s, faster transportation became available within cities as well, as safety bicycles and electric trams allowed for commutes of about 4 miles. They were followed by the underground in the first half of the 20th century and the dominance of cars after 1950. In the US, suburbs expanded; in Europe, new residential araes inspired by Le Corbusier were built outside city centres.
Of course, English isn’t the first to comment on the relation between city growth and mobility. In 1934, Cornelis van Eesteren’s renowned plan for the expansion of Amsterdam, the Algemeen Uitbreidingsplan, was published. As historian Fred Feddes pointed out, Van Eesteren included a map showing cycling distances to the ‘city’, as the city centre was called (in imitation of London). Almost all proposed new parts of Amsterdam would be within 30 minutes’ cycling distance of the city.

The fact that Amsterdam started to grow in the second half of the 19th century might seem to fit well with the advent of faster transportation in that period. But there’s a problem: new means of transportation were introduced relatively late in Amsterdam. Tram lines were electrified between 1900 and 1906 (‘so as to better serve the outer neighbourhoods’). Bicycles didn’t become a widespread means of transportation until 1920. The first underground line wasn’t opened until 1977.
Assuming that bicycles and electric trams were the first enablers of city growth, one would expect the expansion of Amsterdam to have started after 1900. However, the chart at the beginning of this article suggests growth started earlier: in the second half of the 19th century.
So how is it possible that Amsterdam started to expand before bicycles and electric trams enabled further commutes? To explore that matter, I created the map below. For points half a km apart, I used the Open Route Service to calculate travel times to Dam Square. Red lines start at points within 30 minutes’ walking distance from the city centre; blue lines at points within 30 minutes’ cycling distance.
You can use the selector above the map to show where substantial construction took place, by decade (again, see caveats below). During the second half of the 19th century, construction was concentrated in neighbourhoods at the margin of the walkable area, with some expansions slightly further away near the new parks and along the river Amstel. It wasn’t until later that the city firmly expanded beyond the walkable area.
Above, it was noted that Van Eesteren’s expansion plan made sure that new parts of Amsterdam were within cycling distance of the city centre (the plan was implemented after the Second World War). If you zoom out, the map above will show that Amsterdam would largely remain within cycling distance of the city centre until the 1970s, when new housing in South-East Amsterdam was created (followed by IJburg after 2000).
In his article, Jonathan English hints that the relation between city growth and mobility may have been different in Europe. The above analysis of Amsterdam also seems point in that direction. Perhaps the electrification of the tramways stalled until 1900, because until then Amsterdam still had room to grow within the walkable area. And perhaps Amsterdam didn’t open it’s first metro line until the 1970s, because until then, the city had grown largely within the area within cycling distance from the city centre.
How I measured distances within cities
To analyse the historical development of cities, I used the BAG dataset of the Land Registry (Kadaster), which contains the construction year of buildings in the Netherlands (dump available here). It’s a dataset with about 8 million records, so you need to think carefully about how your organise your code, or you’ll end up with scripts that take hours or longer to run.
Of course, this dataset only contains buildings that still exist. While the data gives a pretty good idea of how cities developed historically, in some cases urban renewal, bombing during WWII and other processes will have removed the record of previous construction.
Another problem is how you define a city. By its current city limits? Some cities comprise parts that were separate cities, villages or settlements in the past. Treating them as if they have always been part of the same city would overestimate within-city distances.
The way I dealt with this was to divide the city in areas. For each year, I selected the areas with buildings from that year or earlier. I created clusters of adjacent areas, assuming the largest cluster represents what the city looked like at that moment in time. For each area within that cluster, I calculated the distance between its centre and the centre of the entire cluster. I used the median of these distances.
Note that this approach overlooks Amsterdam Zuidoost, which isn’t connected to the rest of Amsterdam. As a result, distances in Amsterdam in the 1970s and later are underestimated.
A final matter was: what areas to use for the analysis. First I wanted to use neighbourhoods (‘buurten’) as defined by Netherlands Statistics. However, neighbourhoods are small within city centres, but can be rather large at the margins of cities. The same applies to postcode areas. Instead, I decided to assign each building to a 500 x 500m block and use those blocks as the unit of analysis, so as to have uniform area sizes across the city.
How I created the map
On the map, I wanted to show travel times on foot and by bicycle from various parts of the city to the city centre, pretty much as Van Eesteren had done for cycling. Van Eesteren calculated the distances between residential areas and the city centre along main radial roads, and converted these to travel times, assuming an average speed of 15 km/h (he also calculated travel time to industrial areas in the Western Harbour and Duivendrecht). He didn’t take into account ‘various possible causes of delay such as open bridges, traffic lights and congested streets’.
My approach was slightly different. As a start, I took the centres of the blocks described above. For each point, I looked up walking and cycling routes to Dam Square, using the Open Route Service API (which uses Open Street Map). The API also estimates the travel time, so I could identify points within 30 minutes’ walking and cycling distance from Dam Square.
For each decade, I identified blocks where substantial construction took place. For each block, I looked up all addresses with a year of construction within that decade and checked whether their number exceeded a threshold value. Of course, old buildings may have been demolished or otherwise disappeared. As a very rough way to take this into account, I used a threshold that increases from 0 in the year 1000 to 150 in the year 2000.