Chart junk
![]() Twitter has fallen in love with a new study on data visualization. Not surprisingly, for Michelle Borkin and her co-authors promise to throw some light on the great controversy of this field: pro or against chart junk.
Twitter has fallen in love with a new study on data visualization. Not surprisingly, for Michelle Borkin and her co-authors promise to throw some light on the great controversy of this field: pro or against chart junk.
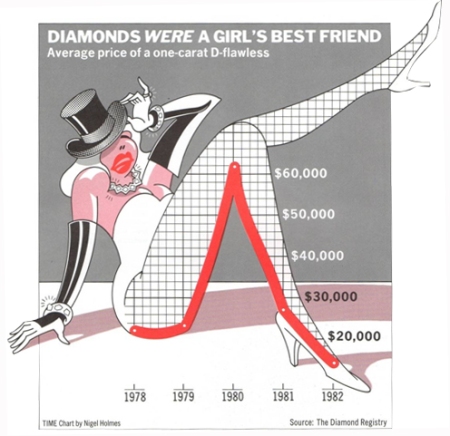
So what’s the controversy about? On the one hand, there are those who think it’s OK to add non-functional embellishments to graphs, because this may make them more engaging and memorable. Usually, Nigel Holmes is quoted as a proponent of this view and this graph is often offered as an illustration.
On the other hand, there are those who dismiss such embellishments as chart junk, which distracts from the content of the graph. The main name here is Edward Tufte, who argues for a high «data-to-ink ratio». The foremost example is his minimalistic but effective slope graph.
Both sides may have a point, but my sympathy lies with Tufte. I’ll admit that some of Holmes’ infographics are actually quite funny, but many embellished graphs you’ll find in the media (Dutch examples here and here) are just silly.
Of course, that’s a matter of taste, but what’s the scientific verdict? Borkin et al. had subjects look at visualizations for a second and tested whether they would recognize them when the same image was shown again. They found that:
visualizations with low data-to-ink ratios and high visual densities (i.e., more chart junk and ‘clutter’) were more memorable than minimal, ‘clean’ visualizations.
So does this settle the matter? Not quite. Borkin and her co-authors say that their findings are just a «first step to understanding how to create effective data presentations». Stephen Few, a well-known critic of chart junk, goes one step further and calls their study «useless» for that purpose. His main point is that the subjects got to look at the examples for just one second:
Visualizations cannot be read and understood in a second. Flashing a graph in front of someone’s eyes for a second tells us nothing useful about the graphical communication, with one possible exception: the ability to grab attention.
I’ll have to agree with Few: Borkin et al. may have demonstrated that chart junk is effective at grabbing someone’s attention, but not that it’s effective at helping people understand data. Apart from that, I maintain that embellished visualizations may sometimes be fun, but will often be silly and/or pretentious.