Dutch governments consider using Strava data
Strava is a popular app to record bicycle rides. For some years, the company has been trying to sell its data to local governments for traffic planning. NDW, a platform of Dutch governments including the city of Amsterdam, has bought six months’ worth of Strava data to give it a try.
The switch to Strava may mean the end of the Fietstelweek, an annual one-week effort to collect bicycle data from thousands of volunteers. In the past, I’ve used Fietstelweek data to analyse waiting times at traffic lights. The Fietstelweek received funding from the same governments that are now experimenting with Strava data.
One reason why they are looking for alternatives is that the number of Fietstelweek participants is lower than they’d like. They seem to have a point. Consider for example the map below, which shows bicycle routes to and from Amsterdam Central Station.
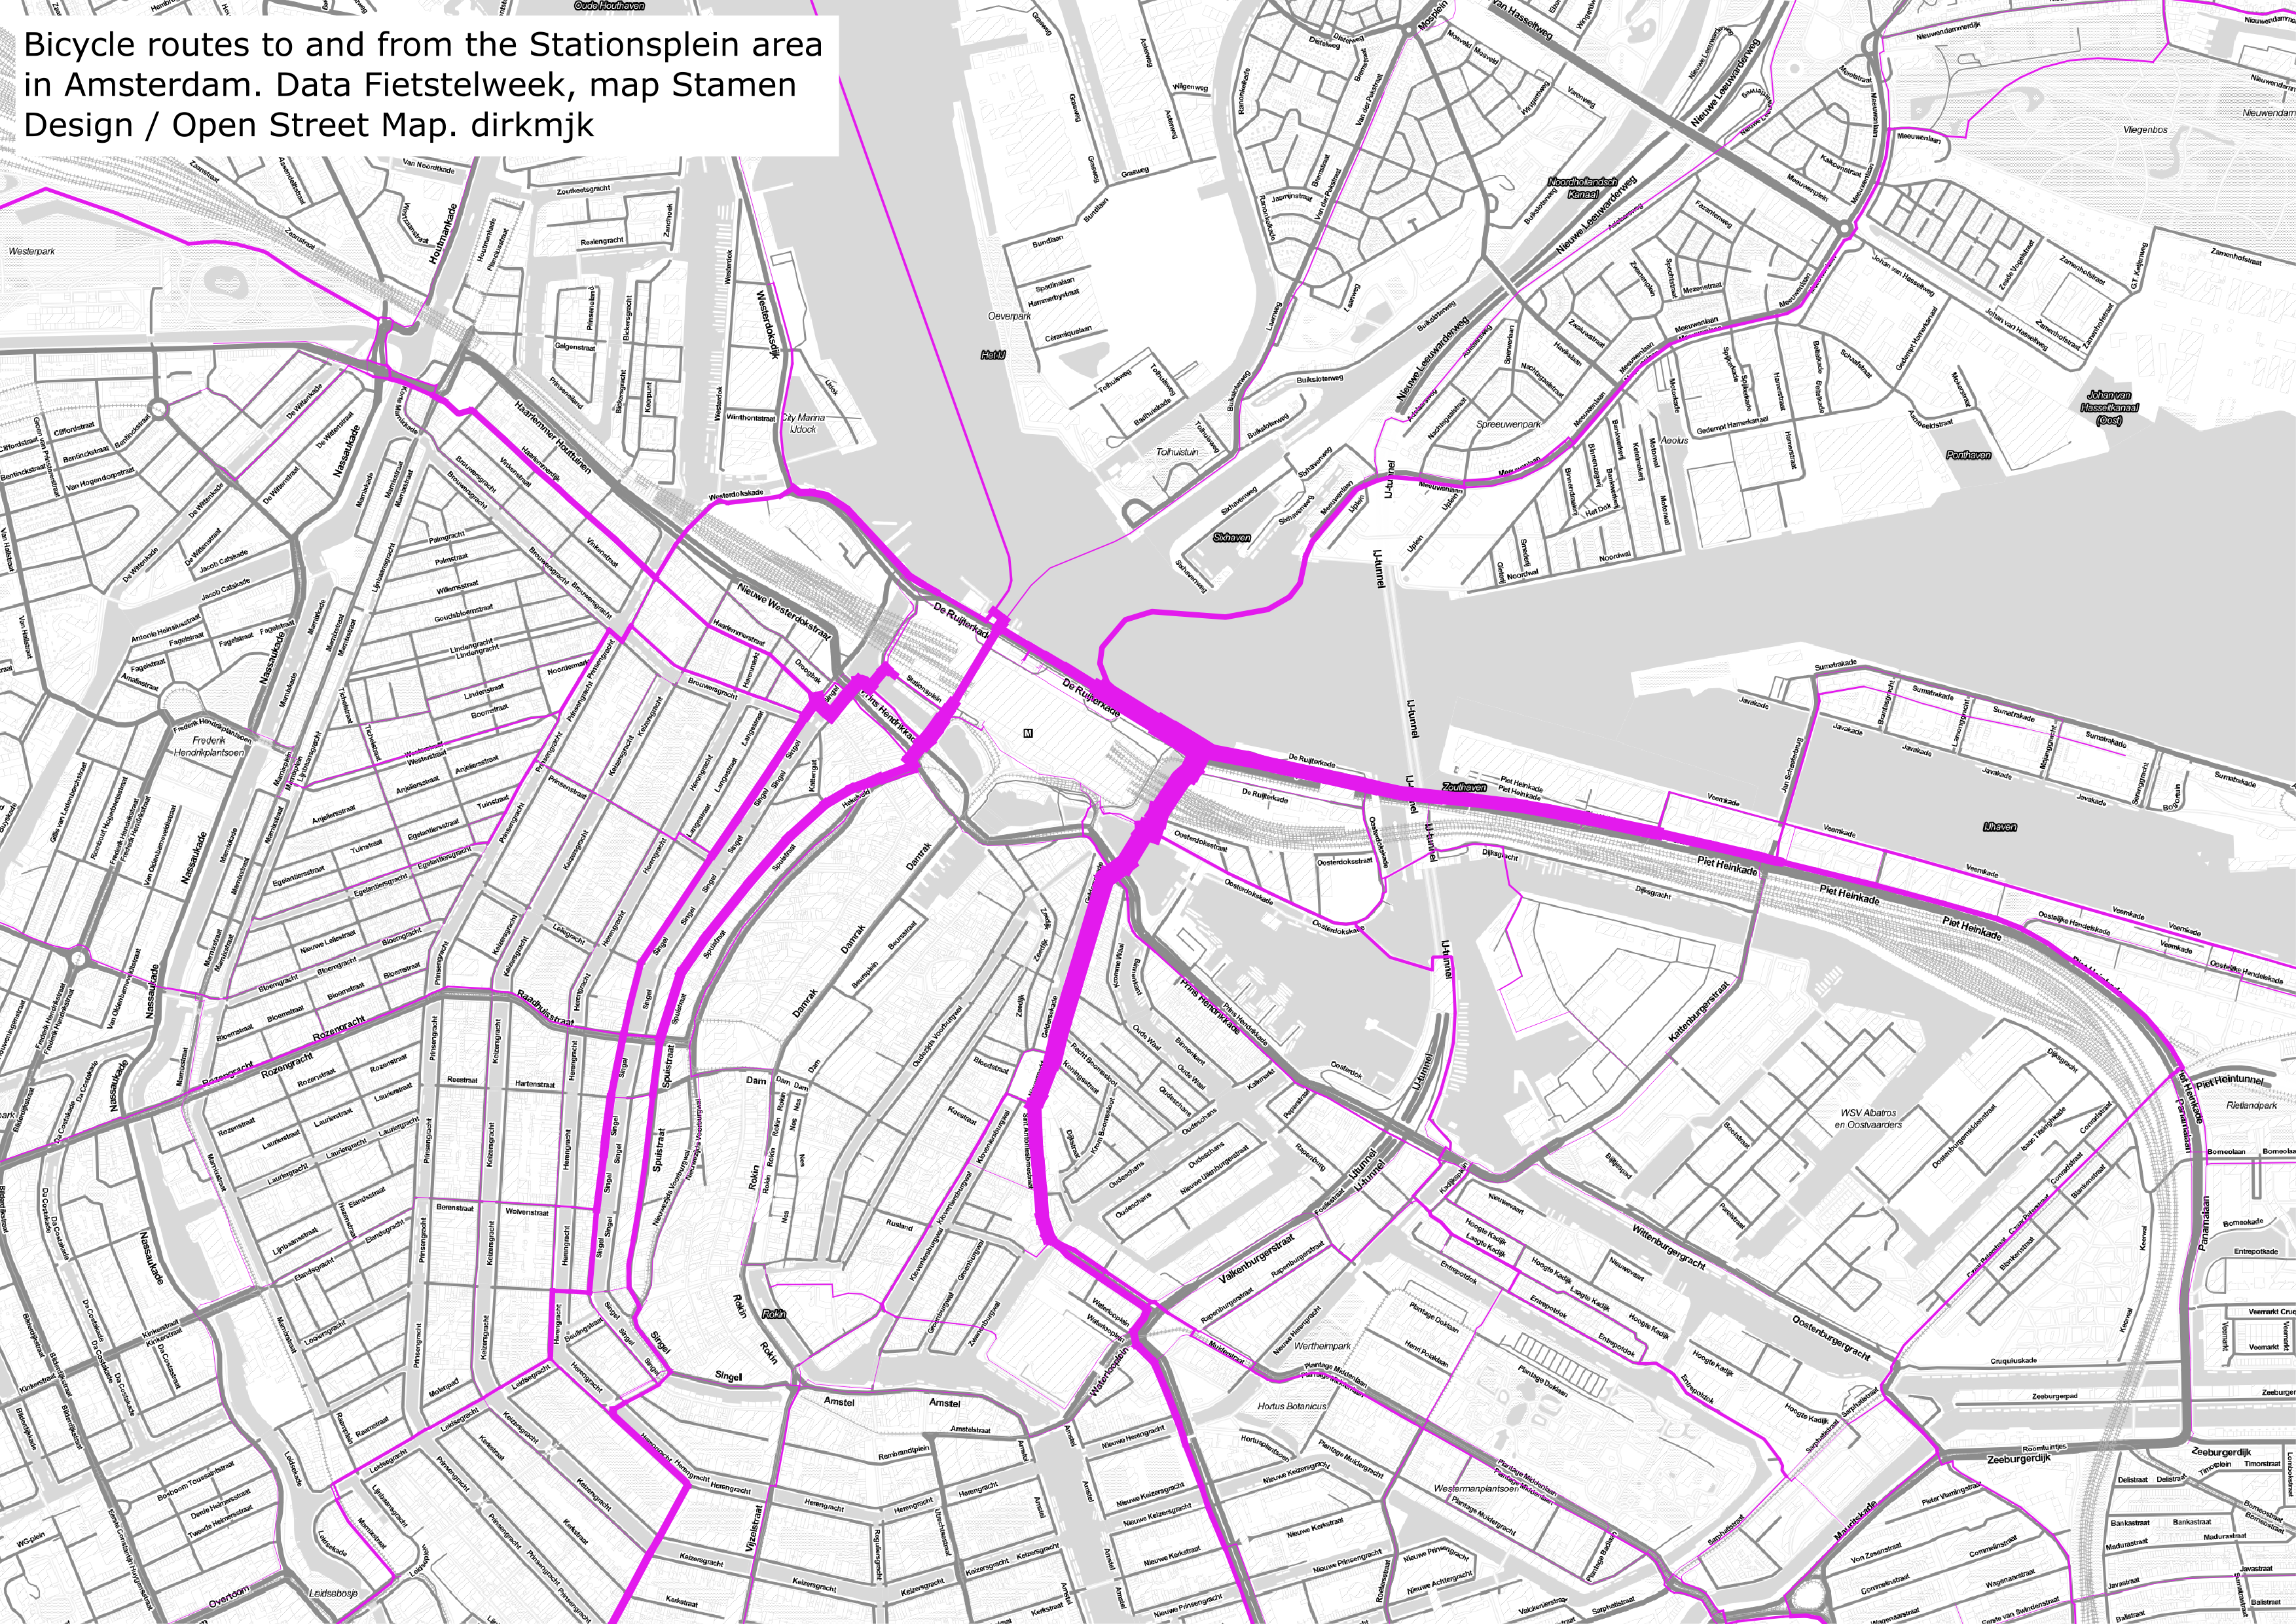
As such, it’s an interesting map. Unsuprisingly, it seems that intensity is highest near the bicycle parking facilities. Main access routes appear to be the Geldersekade (with the sometimes chaotic crossing with Prins Hendrikkade) and the Piet Heinkade. It seems that people cycling to and from Central Station are somewhat more likely to live in the eastern part of the city.
There’s one caveat though: the numbers are small. Even the busiest segments represent at most 40 rides. One loyal Fietstelweek participant recording her commute during the entire week could literally change the map.
Strava has far larger numbers, but its data raises different kinds of questions. Strava calls itself ‘the social network for athletes’ and wants to know if you use a road bike, a mountain bike, a TT bike or a cyclocross bike (no option ‘other’ available). So how representative is Strava data of people who use their city bike for commutes and other practical purposes?
Strava’s response to such questions is that they’re trying to make the app less competition-focused and more social, with Facebook-like features. This should help them collect data about ‘normal’ bike rides. They have also argued that «especially in cities, those with the app tended to ride the same routes as everyone else».
But is that really true? Strava’s heatmap (choose red and rides) for Amsterdam could perhaps be interpreted as a combination of recreational rides (Vondelpark, Amstel) and cyclists trying to get in or out of the city as quickly as possible (plus quite a few people who recorded their laps at the Jaap Eden ice skating rink as bicycle rides).
Perhaps you could find a way to filter out ‘lycra’ rides and end up with a sufficient number of ‘normal’ rides. Then again, almost three-quarters of bicycle rides in the Netherlands are under 3.7 km, and I suspect very few of those short rides end up on Strava.
There’s also a socio-economic aspect. It has been argued that Strava is used most by people living in wealthier neighbourhoods, which aren’t necessarily the neighbourhoods most in need of better cycling infrastructure.
Of course, bicycle use is unequal in the first place, which is also reflected in Fietstelweek data. The map below shows the start and end points of rides for Amsterdam.
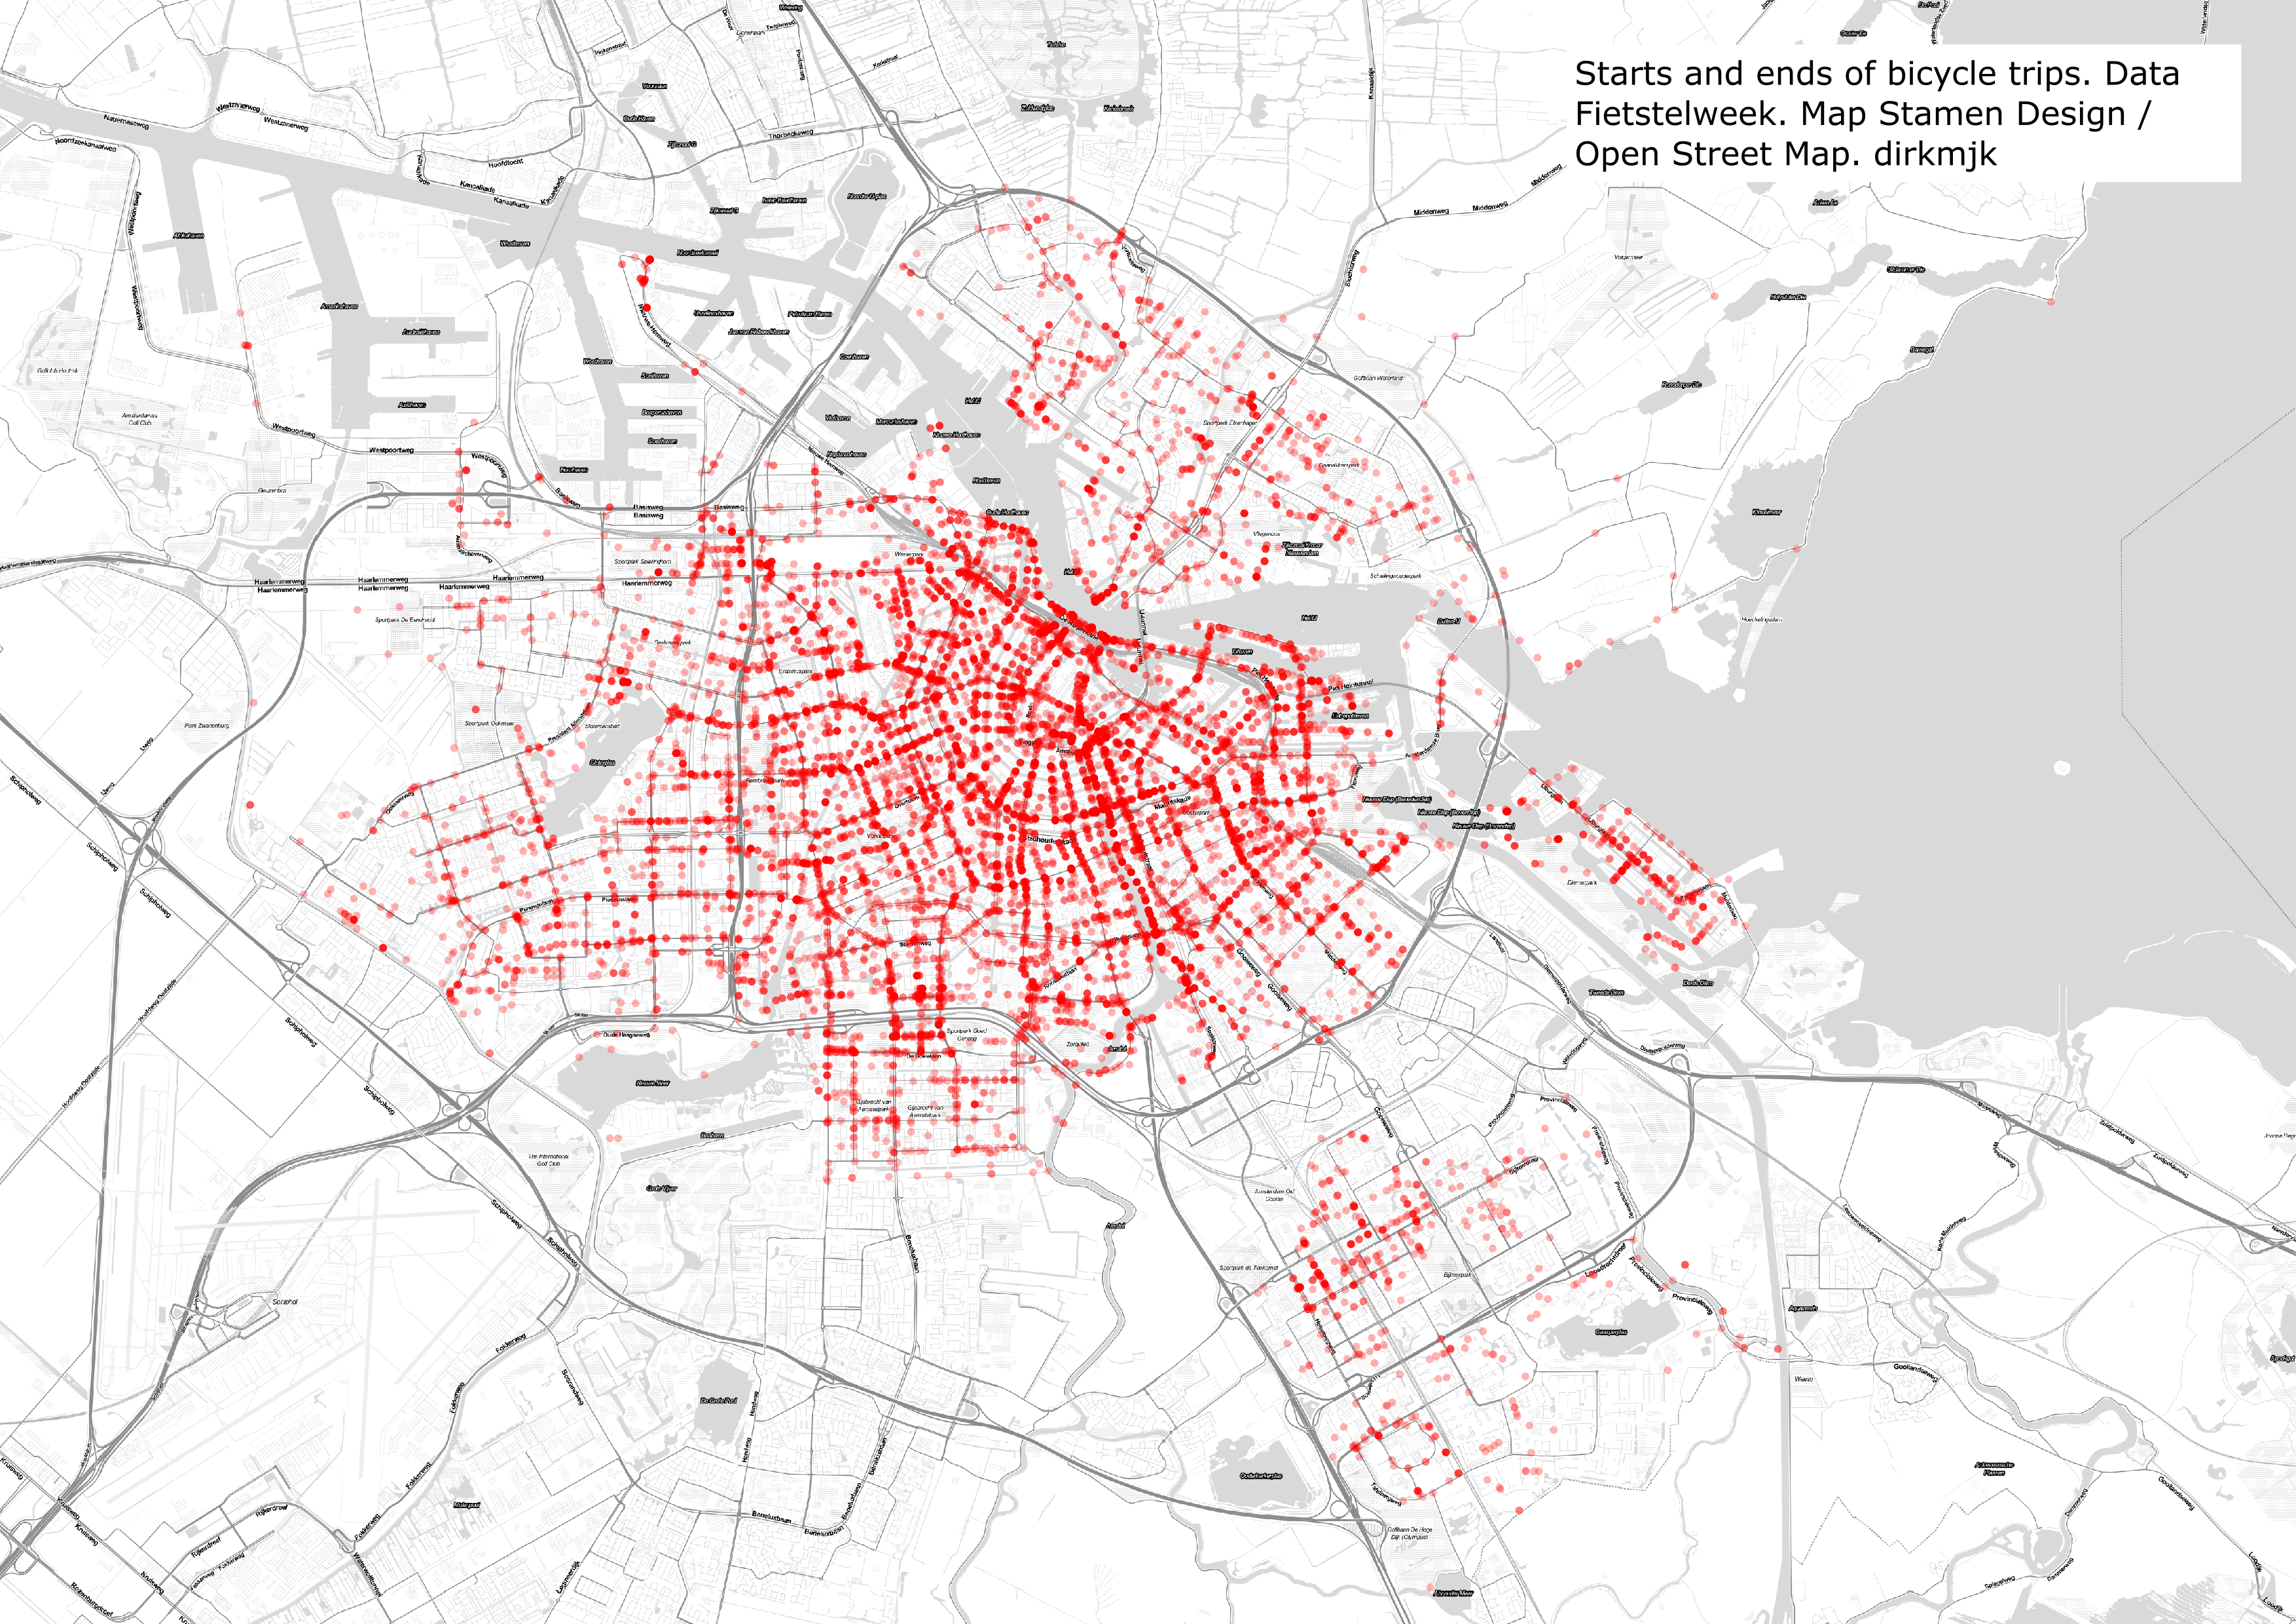
Density is highest in the area within the ring road and south of the IJ. The number of trips per 1,000 residents also correlates with house values: more bicycle trips start or end in affluent neighbourhoods. As said, this probably reflects actual patterns in bicycle use and not a problem of the data.
To summarise, Fietstelweek has smaller numbers than one would like, while Strava data raises questions about representativeness. One way for Strava to help answer these questions would be to make a subset of its Amsterdam data available as open data.
This Python script shows how the analysis was done.